NCTU Big Data Analytics Techniques and Applications Projects
Projects I’ve worked on in graduate-level course Big Data Analytics Techniques and Applications Projects(巨量資料分析技術與應用) in NCTU in Spring 2016.
This course will be completed in June, 2016. Total 3-4 projects expected.
-
BDATAA Project1: Analyzing NYC Taxi Data
In this Big Data Analytics Techniques and Applications project, we were asked to analyze 3-month NYC taxi data (about 5.5GB, 35,088,737 data points). I will only mention the most crucial and difficult problem, which is:
What are the top pickup/dropoff regions?
[ANSWER]
Pickup region:
Centroid at 40°45’20.1”N 73°58’56.6”W (longitutde = -73.98239742908652, latitude = 40.75556979631838) with radius r = 21.86850019225871, total 14,815,015 pickups included.
Dropoff region:
Centroid at 40°45’07.2”N 73°59’04.1”W (longitutde = -73.98447812146631, latitude = 40.75200522654204) with radius r = 27.07032741216307, total 17,186,117 dropoffs included.
** Note:
ris calculated based on the formulasqrt(longitude_diff^2+latitude_diff^2), which I believe is meaningleass and should be converted tokm. (I will do that sometime :P)[DISCUSSION]
I implemented k-means clustering[1] to solve this problem. However, there’s a serious pitfall regarding this algorithm: how to choose k?
To resolve this, I tried to list all possible k’s, ranging from 1~10 (for all three-month data) or 1~50 (for limited amount of data), and chose thekwhen SSE-k function becomes “flat”.
(k 的選擇: 選擇當 SSE-k 函數趨近平緩時的k點)
→ Finally, choosek = 5to do the clustering.Result for different k’s (-1 data points means not limited):
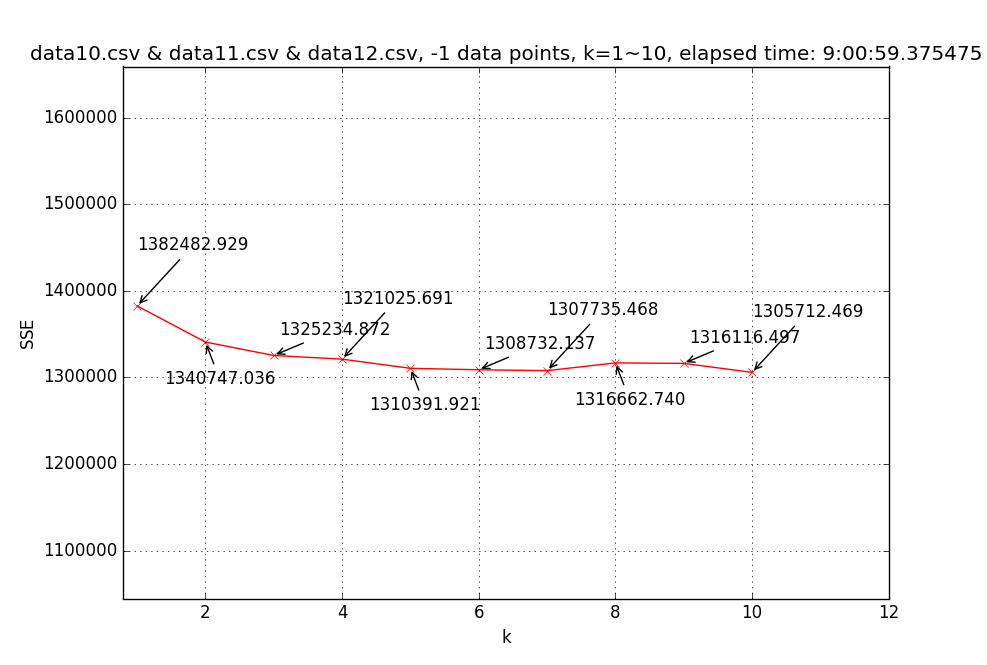 ↑ Line chart of SSE(sum of square error) with different k’s (1~10) based on three-month (Oct.~Dec.) pickup region data (35,088,737 data points).
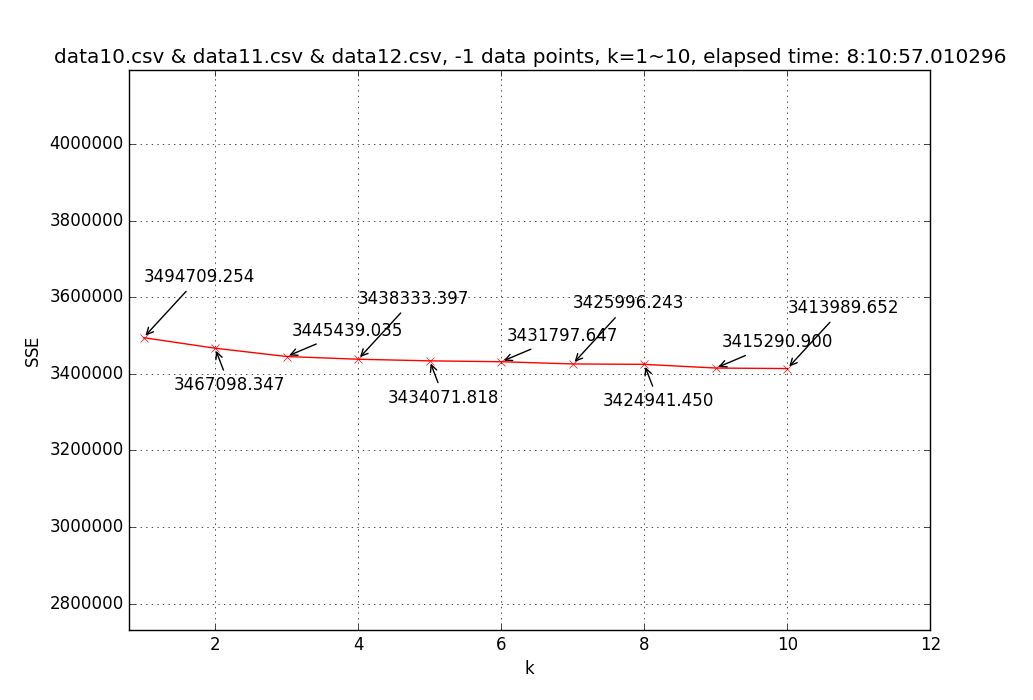 ↑ Line chart of SSE with different k’s (1~10) based on three-month (Oct.~Dec.) dropoff region data (35,088,737 data points).
Result for pickup data with k = 5:
==> 5 clusters with SSE = 1310382.527, total 10 iterations, duration: 0:58:44.093826
-------------
[k = 5] Centroid #0 @(-73.98239742908652,40.75556979631838) with r = 21.86850019225871 [14815015 points]
[k = 5] Centroid #1 @(-73.78023972555476,40.64441273159325) with r = 260.35266030662689 [805122 points]
[k = 5] Centroid #2 @(-73.96136756589190,40.78012632758659) with r = 23.04849337580119 [8147234 points]
[k = 5] Centroid #3 @(-73.99744188868137,40.72594059025759) with r = 662.30254596214866 [9716760 points]
[k = 5] Centroid #4 @(-73.87396560811541,40.76951321876881) with r = 33.88323463224077 [1095900 points]
→ Choose Centroid #0 @(-73.98239742908652,40.75556979631838) with r = 21.86850019225871 [14815015 points]
Result for dropoff data with k = 5:
==> 5 clusters with SSE = 3431839.916, total 36 iterations, duration: 3:28:30.800414
-------------
[k = 5] Centroid #0 @(-73.76951586370677,40.65764030599616) with r = 260.34678752815660 [463269 points]
[k = 5] Centroid #1 @(-73.98447812146631,40.75200522654204) with r = 27.07032741216307 [17186117 points]
[k = 5] Centroid #2 @(-73.95882476626755,40.78457504343687) with r = 439.94876239844325 [8876526 points]
[k = 5] Centroid #3 @(-73.99645795122916,40.71086509646405) with r = 695.53686724899160 [6822543 points]
[k = 5] Centroid #4 @(-73.88058752281310,40.76332250437670) with r = 35.03531452510111 [1260853 points]
→ Choose Centroid #1 @(-73.98447812146631,40.75200522654204) with r = 27.07032741216307 [17186117 points]
Source → cyhuang1230/NCTU_BDATAA
Please look for
HW1_q1.py.
To try:
[1] Download taxi data[2] and rename todata10.csv,data11.csv,data12.csvseparately.
[2] Runpython3.5 HW1_q1.pyNote / Ref.
[1] k-means clustering: A Programmer’s Guide to Data Mining
[2] Taxi data can be downloaded here: October, November, December